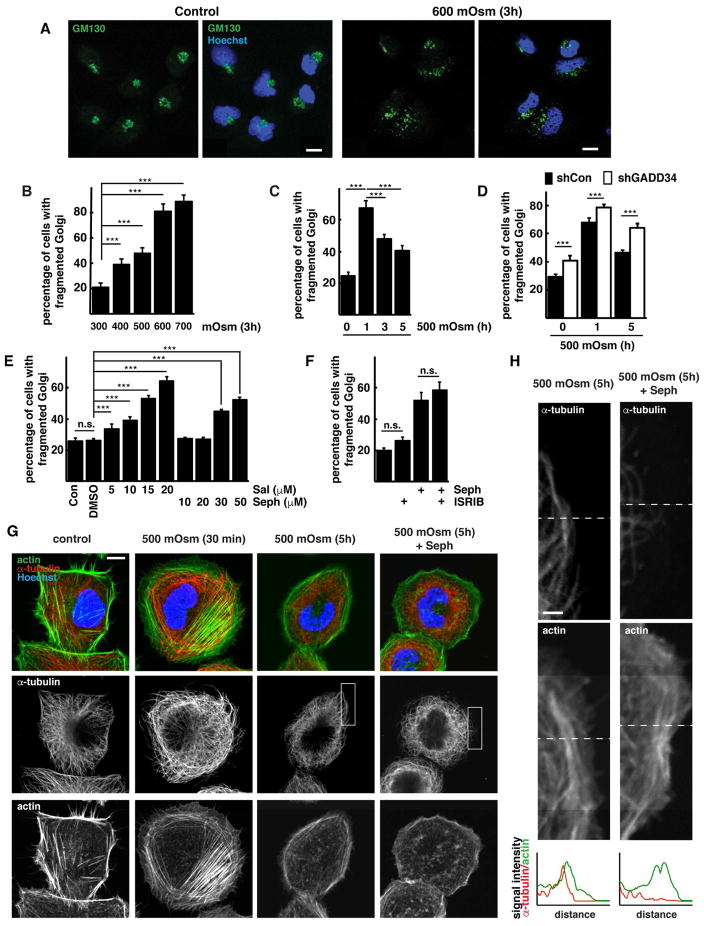
Fig. 3. Osmoprotective functions of GADD34/PP1 in corneal epithelial cells are mediated through reversion of hyperosmotic stress-induced Golgi apparatus fragmentation.
A. Immunofluorescent staining of GM130 (green channel) in cells incubated in control or hyperosmotic (600 mOsm) media for 3h. Scale bar is 10 μm. B. Quantification of Golgi fragmentation in cells incubated at the indicated conditions for 3h. C. Quantification of Golgi fragmentation in cells exposed to 500 mOsm media for the indicated times. D. Quantification of Golgi fragmentation in cells expressing shRNA against GADD34 incubated in 500 mOsm media. E. Quantification of Golgi fragmentation in cells treated with the indicated concentrations of GADD34/PP1 inhibitors in control media for 2h. F. Quantification of Golgi fragmentation in cells treated with the GADD34/PP1 inhibitor Sephin 1 (Seph, 50 μM) with or without ISRIB (25 nM) for 2h. G. Immunofluorescent staining of F-actin (green channel) and α-tubulin (red channel) in cells exposed to 500 mOsm media with or without the GADD34/PP1 inhibitor Sephin 1 (Seph, 50 μM). Scale bar is 10 μm. H. Boxed images from panel F. Dotted lines on the images indicate linescans positions. Graphs below are representing α-tubulin (red) and F-actin (green) signals. Scale bar is 2 μm. Data in panels B–F are represented as mean of 3 experiments ± SD.

