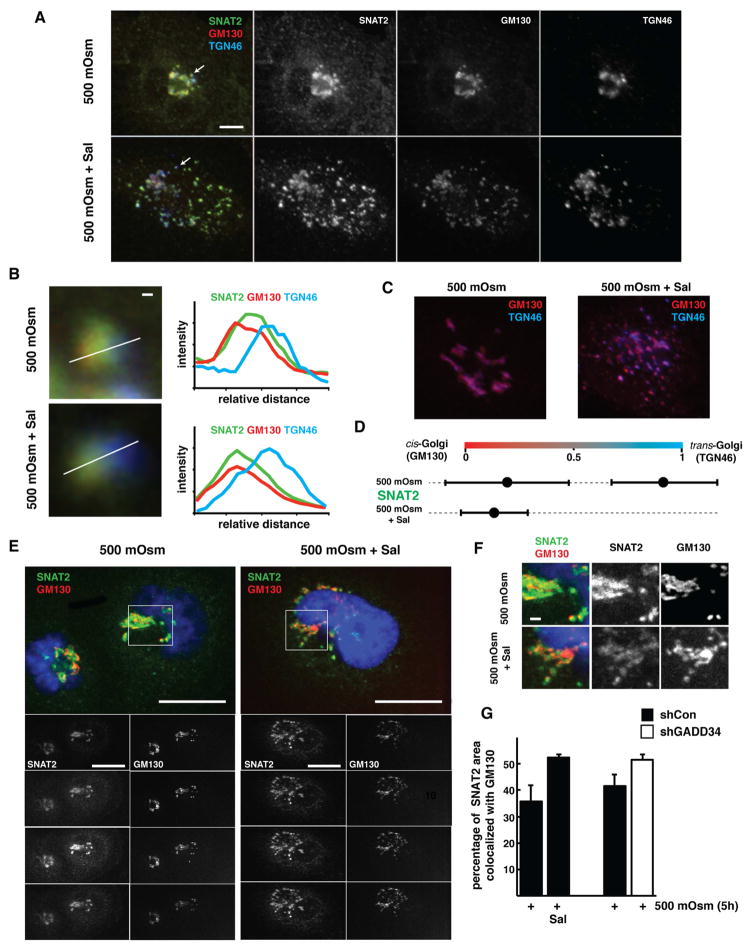
Fig. 5. Inhibition of GADD34/PP1 results in the SNAT2 retention in cis-Golgi in corneal epithelial cells exposed to hyperosmotic stress.
A. Intra-Golgi localization of SNAT2, where cis-Golgi marker is GM130 and trans-Golgi marker is TGN46; in cells treated with 500 mOsm media with or without Sal003 (30 μM) for 5h. Arrows point to the areas enlarged in B. Note Golgi fragmentation and separation of trans-Golgi blue color from SNAT2 and GM130 in Sal003 treated cells. Scale bar is 10 μm. B. Linescan analysis of SNAT2 intra-Golgi localization, with representative examples of linescanes and plots of three channel intensities through regions with separated cis- and trans-Golgi. Scale bar is 1 μm. C. Representative Golgi morphology and overlap between cis- and trans-Golgi staining in 500 mOsm cell treated with or in absence of Sal003. D. Graph represents quantitation of analysis of 14 line scans from 6 cells treated with 500 mOsm media and 45 linescans taken from 14 cells treated with 500 mOsm media in the presence of Sal003 (30 μM) respectively. Data are represented as mean ± SD. E. Subcellular localization of SNAT2 and cis-Golgi marker GM130 in cells treated with 500 mOsm media for 5h with or without Sal003 (30 μM). Scale bar is 10 μm. F. Magnifications of cell area as indicated in panel E. Note SNAT2 areas that do not overlap with GM130 staining in 500 mOsm treated cells, and their disappearance upon Sal003 addition. Scale bar is 1 μm. G. Quantification of SNAT2 area overlapping with GM130. Data are represented as mean of 3 experiments ± SD.

