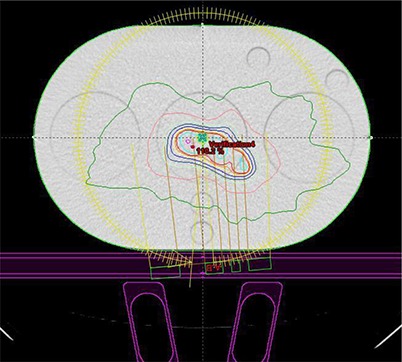
Figure 6.

The axial view of a GYN verification plan computed using the QUASAR phantom's CT dataset. Couch and rails in the IN position are considered for dose calculation. The six locations for the ion chamber during measurements are displayed as small circles.
