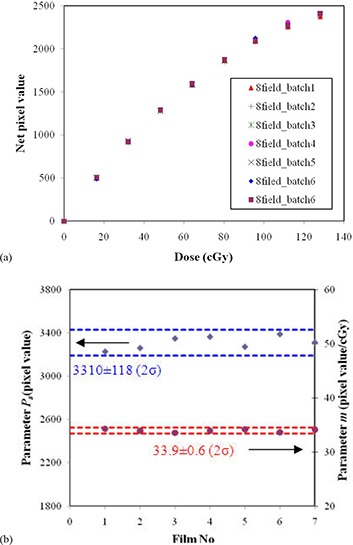
Figure 2.

Intra‐day variations of calibration curves using the 8‐field method (a); intra‐day variations of parameters (diamond) and m (circle) for the 8‐field method (b) with the average and two standard deviations (2σ) shown. Film No. 6 and 7 were in the same batch (batch 6).
