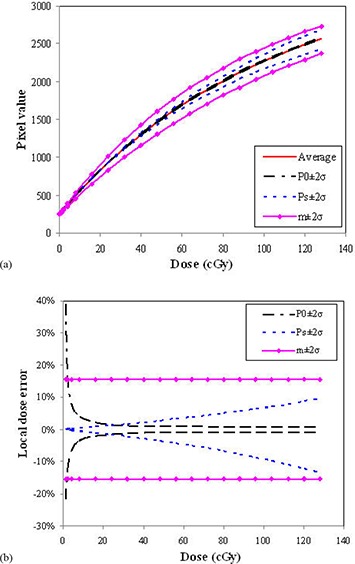
Figure 4.

Model parameters influence on film response curves. The effects of parameters (, , m) at the 95% confidence level due to daily variation on the curvatures of calibration curves (a), and on the local dose error as a function of dose (b). Average calibration curve was calculated with , , and m parameters of 245, 3271 and 31.7, respectively.
