Figure 7.

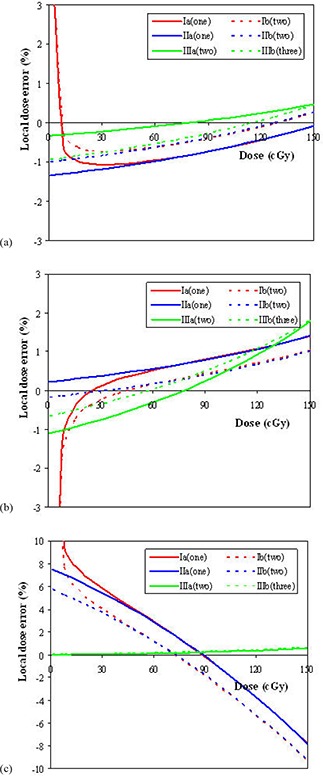
The local dose errors as a function of dose for geometry 1 () (a), geometry 2 () (b) and geometry 3 () (c) on the different days. The local dose error means the dose difference relative to the true dose for the same pixel value.

The local dose errors as a function of dose for geometry 1 () (a), geometry 2 () (b) and geometry 3 () (c) on the different days. The local dose error means the dose difference relative to the true dose for the same pixel value.