
Figure 2.
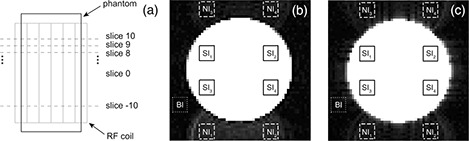
Set up of water phantom acquisitions (a); measurements of and were performed in slice 0 which is the median slice of the acquired phantom volume. Scanner‐A (b): images with and . Scanner‐B (c): images with and . The ROIs (b, c) used for the measurement of signal intensity within the phantom (solid line), and the ROIs used for the measurement of signal intensity of Nyquist ghost (dashed line) and background (BI) (dotted line), are shown. The ROIs employed for the measurement of are shifted by N/2 voxels (64/2) along the phase encoding direction in respect to the corresponding ROIs employed for the measurement of .