
Figure 5.
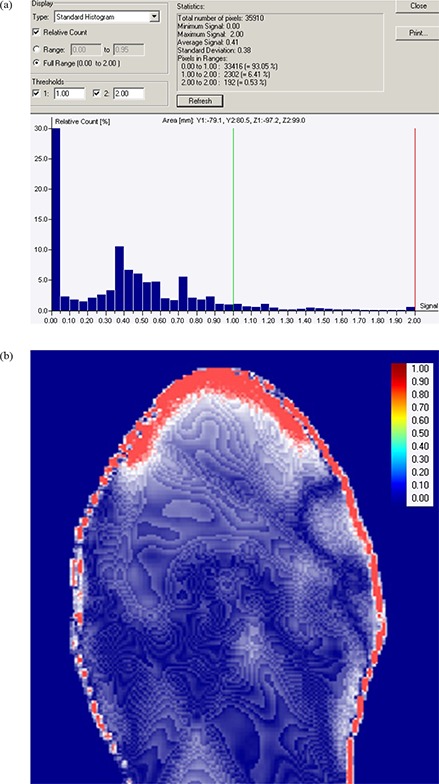
The histogram (a) of gamma values (gamma evaluation parameters of 3% dose difference and 3 mm distance to dose agreement) between AAA and PBC on transverse plane at isocentre; (b) the increase of gamma values from blue color to red color showing the increase in dose difference in dose buildup region.