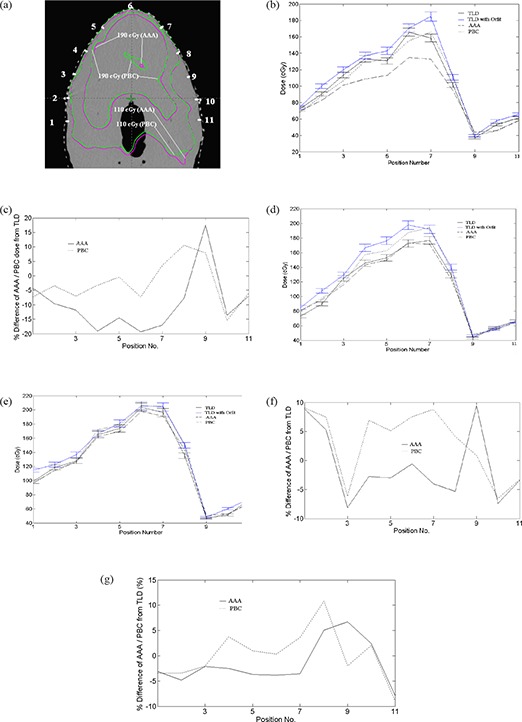
Figure 7.

The positions (a) (represented by white spots for TLD placement) and the comparison of dose distributions of PBC and AAA on the transverse axial slices at isocentre, with inner green and magenta isodose curves representing the 190 cGy isodose curves calculated by PBC and AAA respectively, and the outer green and magenta curves representing 110 cGy isodose curves calculated by PBC and AAA respectively. This shows the better homogeneous dose calculated by AAA than that of PBC. Figs. (b), (d) and (e) show the graphs of TLD without orfit (black error bar in dose), TLD with orfit (blue error bar in dose), PBC (black short discontinuous line), and AAA (black long discontinuous line) at 2 mm, 4 mm and 6 mm depths, respectively. Figs. (c), (f) and (g) show the graphs of the variation of AAA (black line) and PBC (black discontinuous line) from TLD doses at 2 mm, 4 mm and 6 mm depths, respectively.
