
Figure 9.
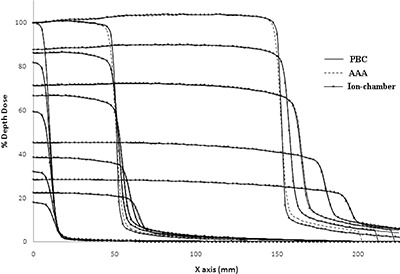
Comparison of calculated dose profiles (AAA and PBC) at depth of dose maximum , 5 cm, 10 cm, 20 cm and 30 cm depths and measured dose profiles using CC13 ion chamber at the same depths for field sizes of and .
Official websites use .gov
A
.gov website belongs to an official
government organization in the United States.
Secure .gov websites use HTTPS
A lock (
) or https:// means you've safely
connected to the .gov website. Share sensitive
information only on official, secure websites.
Comparison of calculated dose profiles (AAA and PBC) at depth of dose maximum , 5 cm, 10 cm, 20 cm and 30 cm depths and measured dose profiles using CC13 ion chamber at the same depths for field sizes of and .