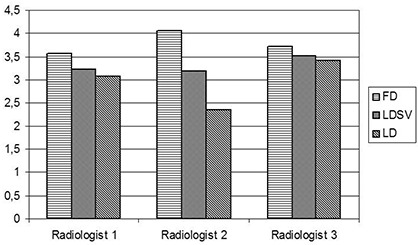
Figure 4.

Variation in overall score between radiologists. For all radiologists the total score is highest for the full‐dose (FD) images and lowest for the low‐dose (LD) images. SV is the SharpView postprocessed images; FD is the mean score for each radiologist of the full‐dose series; LD is the mean score for each radiologist of the low‐dose series.
