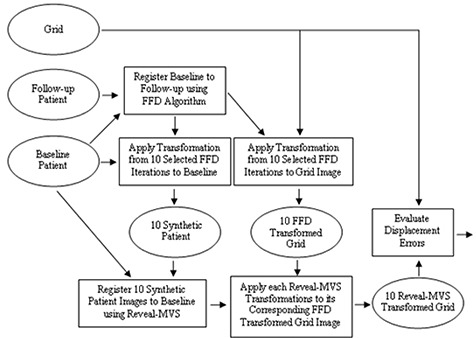
Figure 2.

Flowchart showing the steps and images involved in the synthetic transformation based intra‐modality validation study. Rectangles represent steps or actions, while images are denoted by ellipses. Patient baseline, follow‐up and grid images are procedural inputs and evaluated displacement errors are outputs.
