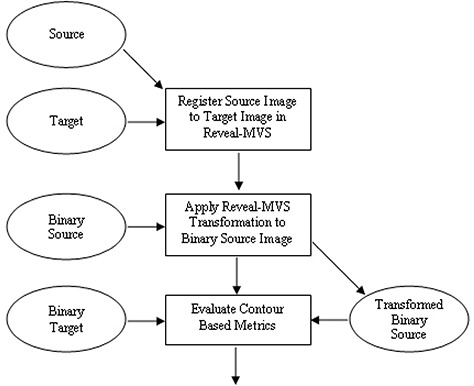
Figure 3.

Flowchart showing the steps and images involved in the contour based inter‐modality validation study. Rectangles represent steps or actions, while images are denoted by ellipses. Source, target, binary source and binary target images are procedural inputs, and evaluated contour based metrics (Tannimoto Coefficient, Dice Similarity Coefficient and mean surface distance) are outputs.
