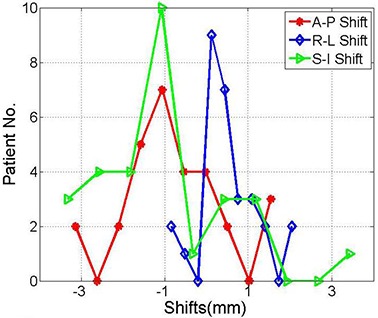
Figure 5.

Histograms show the shifts between the kV projections acquired on the treatment machine and the DRRs from the treatment planning system in the anterior‐posterior, right‐left and superior‐inferior directions, respectively. The kV projections were obtained after patient setup modification using kV image guidance.
