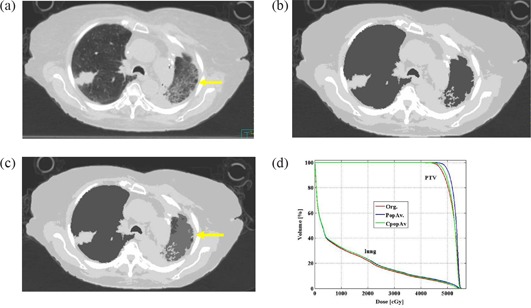
Figure 4.

An example of a patient with pneumonia (yellow arrow) in the left lung. original treatment planning CT image (lung window); (b) treatment planning CT image of the same slice as 4a with the 5 bulk densities applied; (c) treatment planning CT image of the same slice as Figs. 4(a) and (b) where the individual average density is applied to the lung and is applied to the ground glass appearance area (yellow arrow); (d) DVH comparing the PTV and lung of the 3 plans.
