Figure 4.

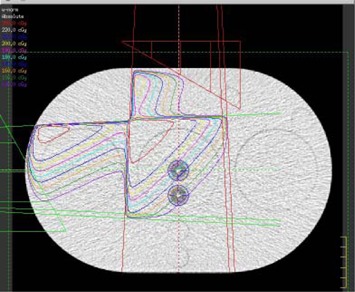
Wedged‐plan as described by the treatment planning system creating a uniform dose gradient across the two detectors. Isodose lines are in 5% dose steps. The detectors are the two white points (circled) near the center of the phantom.

Wedged‐plan as described by the treatment planning system creating a uniform dose gradient across the two detectors. Isodose lines are in 5% dose steps. The detectors are the two white points (circled) near the center of the phantom.