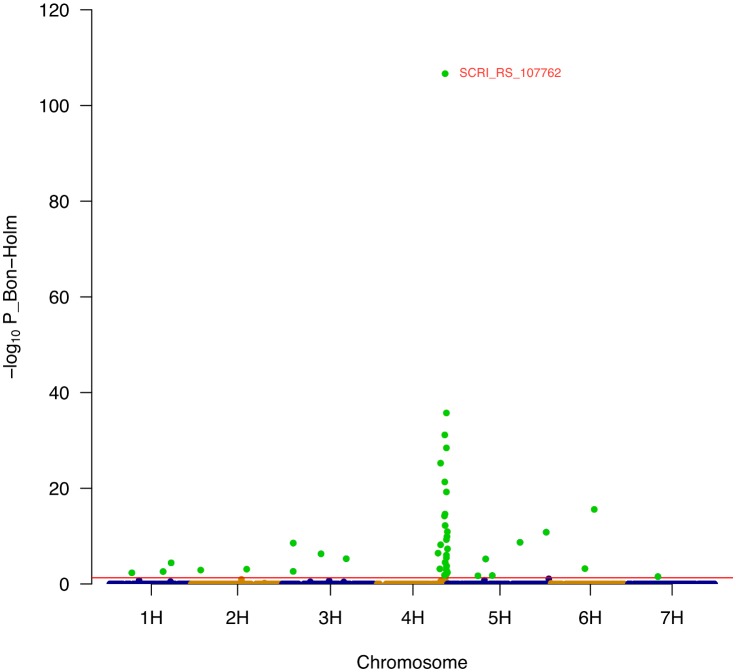
Fig 2. Manhattan plot for GWAS analysis of leaf sheath hairiness.
The y-axis shows the −log10 of Bonferroni-Holm-adjusted P-values. The horizontal red line (−log10 P_Bon-Holm = 1.3) indicates the significance threshhold of P_Bonferroni-Holm = 0.05. Green dots indicate signifcant SNPs exhibiting a Bonferroni-Holm corrected p-value <0.05.

