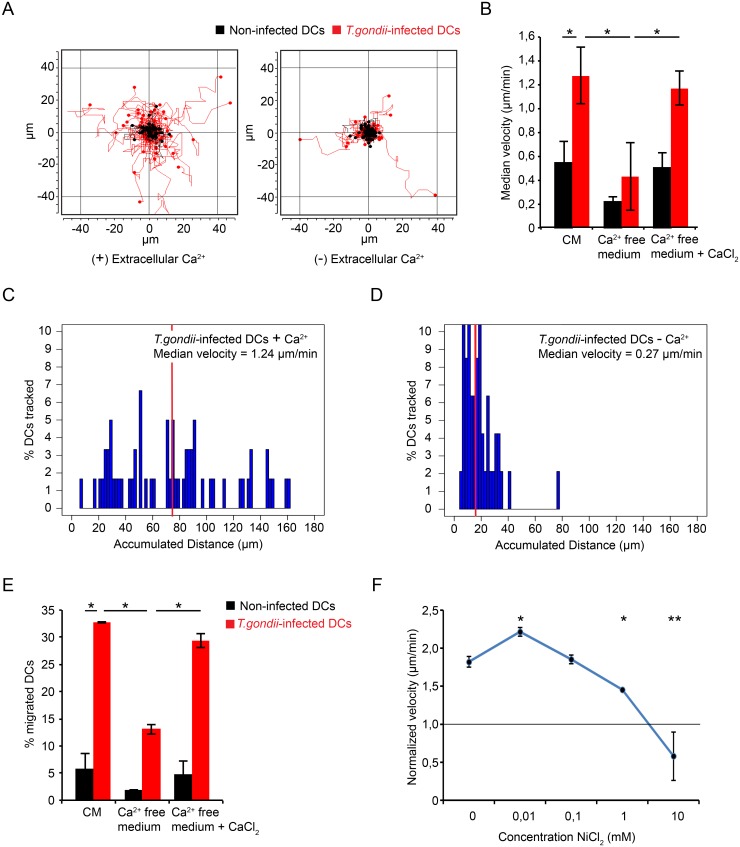
Fig 1. DC hypermotility and transmigration are abrogated at low extracellular Ca2+ concentration.
(A) Representative motility plot analysis of DCs challenged with T. gondii in Ca2+-free medium, 1% FBS ± CaCl2 (1.8 mM). DCs were pre-incubated with freshly egressed T. gondii PRU-RFP tachyzoites (MOI 3, 4 h) in complete medium (CM) as described in Materials and Methods. Red and black track plots indicate infected DCs (RFP+) and non-infected DCs (RFP-), respectively. (B) Bar graph represents median velocity of DCs from 3 independent experiments (n = 60 cells per experiment) performed as in (A). Asterisks indicate significant differences (*: p < 0.001, Pairwise Wilcoxon rank-sum test, Holm correction). (C and D) Histograms show distributions of accumulated distances migrated by T. gondii-infected DCs in the presence (C) or absence (D) of extracellular Ca2+. Vertical red lines indicate, for each condition, the median distance migrated by cells. Significant differences in distances migrated were observed between the conditions (p < 0.001, Wilcoxon rank-sum test, Holm correction). Data are representative of 3 independent experiments. (E) Transmigration frequency of DCs incubated with freshly egressed T. gondii tachyzoites (MOI 3) for 6 h in CM. Transmigration assay was performed in Ca2+-free medium or in CM as described under Materials and Methods. Data represent means (± SD) of 3 independent experiments. Asterisks indicate significant differences (*: p < 0.01, One-way ANOVA, Tukey’s HSD test). (F) Normalized velocity of DCs incubated with freshly egressed T. gondii PRU tachyzoites (MOI 3) for 3 h in CM and treated with NiCl2 for 1 h. Data represent median velocities (± SD) from 2 independent experiments (n = 60 cells per experiment) normalized against a non-infected control (horizontal line). Asterisks indicate significant differences vs. non-treated control (*: p < 0.05, **: p < 0.001, Steel’s Many-one Rank test, Holm correction).

