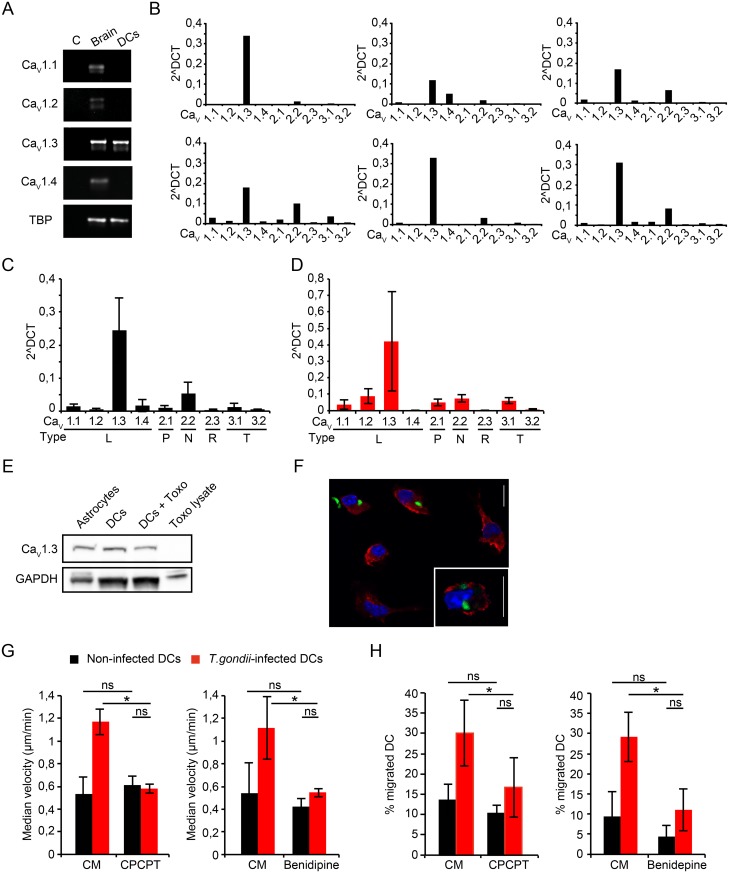
Fig 5. Expression of VDCCs in murine DCs and link to hypermigration of Toxoplasma-infected DCs.
(A) RT-PCR using primers against CaV α1 subunits CaV1.1, 1.2, 1.3, 1.4, as detailed in Materials and Methods. Gel shows template negative (C), whole brain lysate (brain) and DC cDNA. Data are representative of 3 independent experiments. (B) qPCR using primers against α1 subunits of CaV1.1, 1.2, 1.3, 1.4, 2.1, 2.2, 2.3, 3.1 and 3.2 as detailed in Materials and Methods. Each graph depicts expression levels in DCs derived from one individual mouse (n = 6). ΔCt values were calculated with TBP as reference gene. (C) Compiled qPCR analysis as in (B). ΔCt values are given as means ± SEM of 6 independent experiments performed in duplicate. (D) Compiled qPCR analysis as in (C) for T. gondii-challenged DCs. ΔCt values are given as means ± SEM of 4 independent experiments performed in duplicate. (E) Western blot of lysates from primary astrocytes, unchallenged DCs (DCs), DCs challenged with T. gondii tachyzoites (DCs+ Toxo) and tachyzoite lysate (Toxo lysate) immunoblotted with CaV1.3 mAb as detailed in Materials and Methods. GAPDH was used as loading reference. (F) Immunocytochemistry of DCs incubated with GFP-expressing T. gondii tachyzoites (green), stained with CaV1.3 monoclonal antibody (red) and DAPI (blue) as described in Materials and Methods. Scale bars: 10 μm. (G) Motility analysis of DCs challenged with T. gondii tachyzoites (PTG, 3 h, MOI 3) followed by treatment (1 h) with selective CaV1.3 inhibitor CPCPT (1 μM) or benidipine (10 μM), respectively. Data represent median velocities ± SD of 3 independent experiments. Asterisks indicate significant differences (*: p < 0.001, ns: p ≥ 0.05, Pairwise Wilcoxon rank-sum test, Holm correction). (H) Transmigration frequency of DCs challenged with T. gondii tachyzoites followed by treatment (1 h) with CPCPT (10 μM) or benidipine (40 μM), respectively. Data represent means ± SD of 3 independent experiments performed in duplicate. Asterisks indicate significant differences (*: p < 0.02, One-way ANOVA, Tukey’s HSD test).

