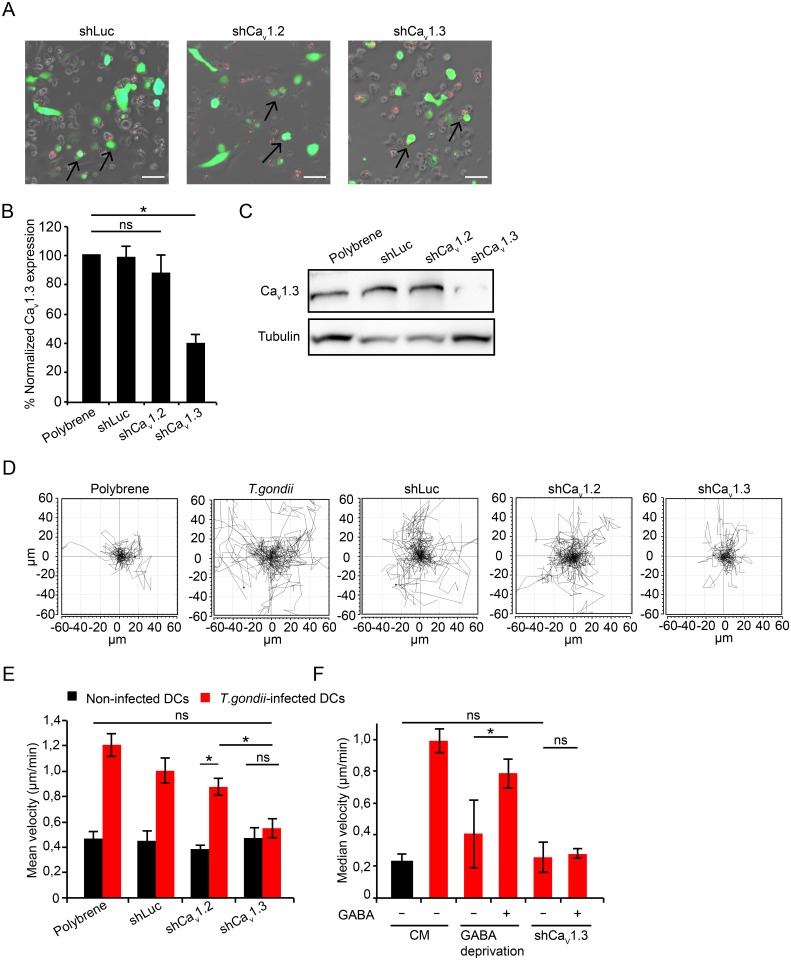
Fig 6. CaV1.3 gene silencing abolishes DC hypermotility.
(A) Live cell imaging of DCs transduced with EGFP-expressing lentiviral vectors (green) carrying shRNA targeting CaV1.3 (shCav1.3), CaV1.2 (shCav1.2) or a non-related target (Control shRNA, shLuc) as indicated under Materials and Methods. DCs were challenged with RFP-expressing tachyzoites (PRU, MOI 3, 4 h, red). Arrowheads indicate representative infected cells expressing EGFP-reporter (red + green) assessed in the assay. Scale bar: 50 μm. (B) Relative Cav1.3 expression in DCs transduced with shCav1.3, shCav1.2 and control shLuc related to mock-transduced DCs (polybrene-treated). Data represents mean ± SEM from 4 independent experiments. (*: p < 0.05, ns: p ≥ 0.05, Student´s t-test). (C) Expression of Cav1.3 protein after treatment with polybrene and transduction with shLuc, shCav1.2 or shCav1.3, analyzed by Western blotting as indicated under Materials and Methods. Data is representative of 3 independent experiments. (D) Motility plots of DCs transduced with lentiviral vectors carrying shRNA targeting CaV1.2, CaV1.3 or control shLuc and challenged with T. gondii tachyzoites (PRU, MOI 3) as indicated under Materials and Methods. “Polybrene” indicates mock-transduced DCs. Data is representative of 4 independent experiments. (E) Motility analysis of DCs transduced as in (D). Data represent mean velocities ± SD of 4 independent experiments. Asterisks indicate significant differences (*: p < 0.001, ns: p ≥ 0.05, Pairwise Wilcoxon rank-sum test, Holm correction). (F) Motility analysis of DCs transduced with recombinant lentiviral vectors carrying shRNA targeting Cav1.3. DCs were challenged with T. gondii tachyzoites ± SC (50 μM, GABA-deprived) ± GABA (5 μM). CM indicates complete medium. Data represent median velocities ± SD of 2 independent experiments. Asterisks indicate significant differences (*: p < 0.01, ns: p ≥ 0.05, Pairwise Wilcoxon rank-sum test, Holm correction).

