
Figure 6.
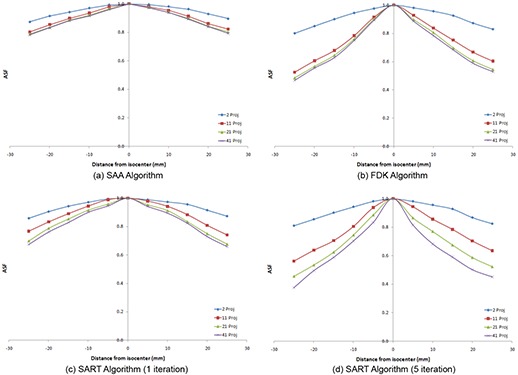
Representative graphs depicting the variation of ASF with number of projections used for each of the algorithms: (a) SAA algorithm; (b) FDK algorithm; (c) SART algorithm (1 iteration); (d) SART algorithm (5 iterations).
Official websites use .gov
A
.gov website belongs to an official
government organization in the United States.
Secure .gov websites use HTTPS
A lock (
) or https:// means you've safely
connected to the .gov website. Share sensitive
information only on official, secure websites.
Representative graphs depicting the variation of ASF with number of projections used for each of the algorithms: (a) SAA algorithm; (b) FDK algorithm; (c) SART algorithm (1 iteration); (d) SART algorithm (5 iterations).