Figure 1.

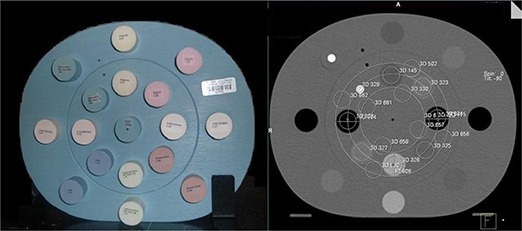
Image (left) and CT (right) of the heterogeneity phantom. The regions of interests shown on the CT are the same that are used for the various CBCTs.

Image (left) and CT (right) of the heterogeneity phantom. The regions of interests shown on the CT are the same that are used for the various CBCTs.