Figure 1.

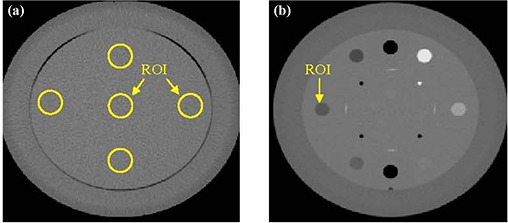
CBCT slices that represent: (a) the uniformity module with regions‐of‐interest (ROI) used to calculate average CT and standard deviation; (b) the linearity module.

CBCT slices that represent: (a) the uniformity module with regions‐of‐interest (ROI) used to calculate average CT and standard deviation; (b) the linearity module.