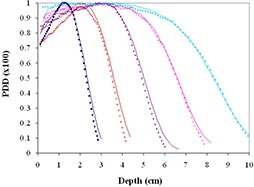
Figure 2.

Percent depth dose curve comparisons between eMC calculations and EBT in water measurements for open field at 100 cm SSD using cone. All curves are normalized to 100%. The Eclipse measurements are represented by solid lines while the EBT measurements are represented by dotted lines as follows: 6 MeV (dark blue), 9 MeV (brown), 12 MeV (purple), 16 MeV (magenta), 20 MeV (light blue).
