Figure 1.

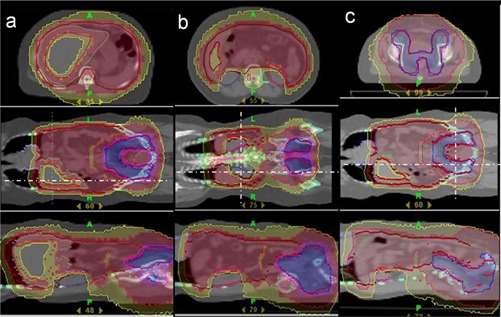
The isodose distribution at various axial sections: (a) at the level of the liver; (b) at the level of the kidneys; (c) at the level of the rectum and bladder. Red indicates 25Gy, yellow 20Gy, Blue 45Gy.

The isodose distribution at various axial sections: (a) at the level of the liver; (b) at the level of the kidneys; (c) at the level of the rectum and bladder. Red indicates 25Gy, yellow 20Gy, Blue 45Gy.