Figure 7.

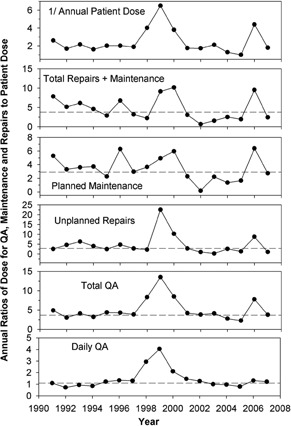
Annual ratios of dose for QA, maintenance and repairs to patient dose. The horizontal lines indicate the average ratios of the respective dose excluding the years 1998–2000 and 2006 which reported extremely small patient numbers.

Annual ratios of dose for QA, maintenance and repairs to patient dose. The horizontal lines indicate the average ratios of the respective dose excluding the years 1998–2000 and 2006 which reported extremely small patient numbers.