Figure 6.

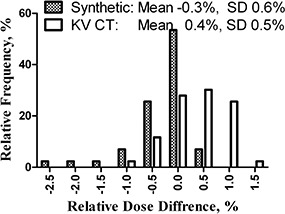
Histogram of relative measured vs. calculated (on synthetic and physical CT datasets) point dose differences for a single beam at 45° incidence angle to both detector planes.

Histogram of relative measured vs. calculated (on synthetic and physical CT datasets) point dose differences for a single beam at 45° incidence angle to both detector planes.