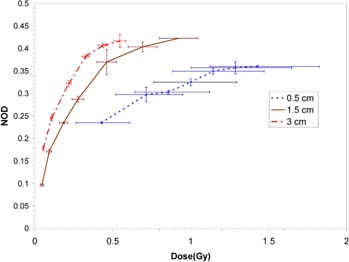
Figure 3.

Measured dose response curves for XR‐QA film at the three measurement source‐to‐film distances in water. Vertical error bars are based on the standard deviation of three separate measurements, and horizontal error bars on an assumed 1.0 mm uncertainty in establishment of the source‐to‐detector distance and 0.01 minute timer error.
