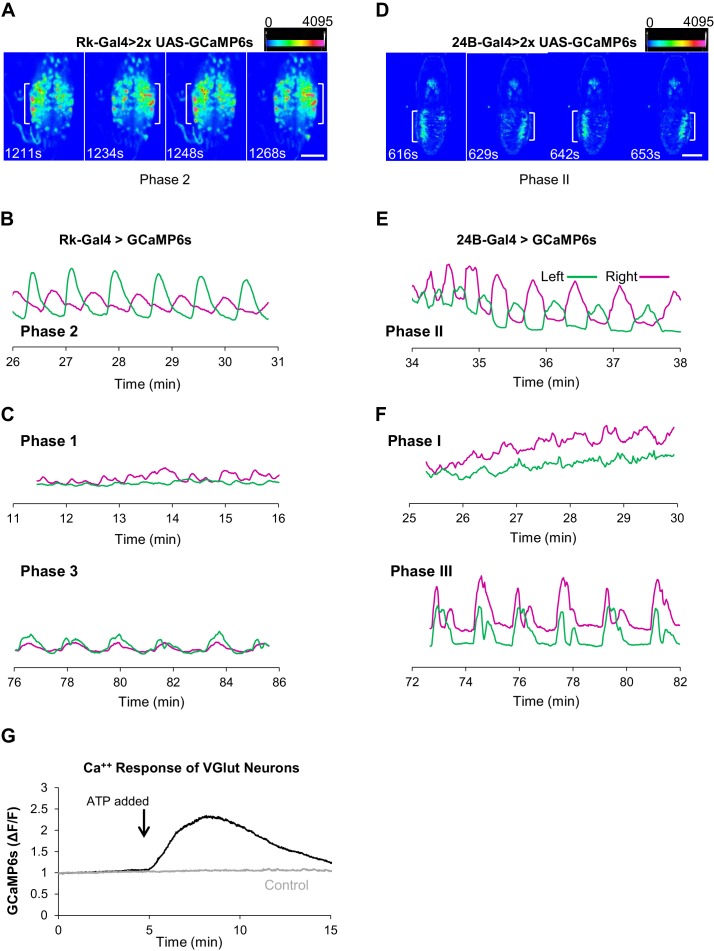
Figure 5. Rk-expressing neurons act in central pattern generation.
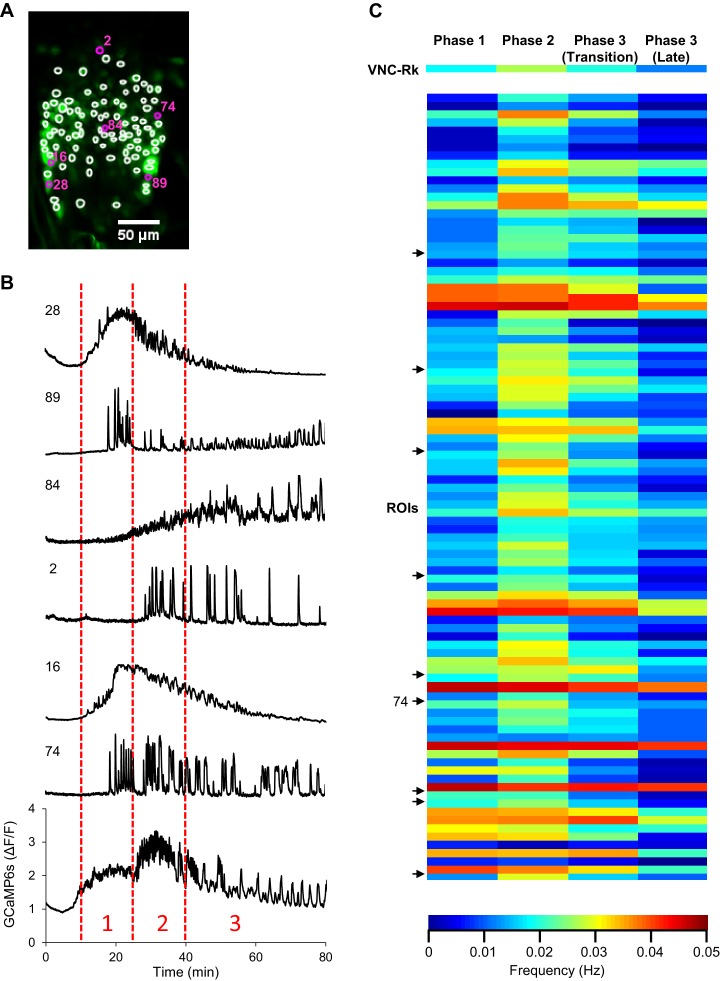
(A–C) Analysis of ETH1-induced Ca++ activity in VNC-Rk neurons. (A) Images from two complete cycles of alternating Ca++ signal in VNC-Rk neurons during Phase 2. Images correspond to the indicated times of peak signal (brackets) on each side of the midline. Scale bar: 100 μm. (B) Phase 2 Ca++ signals from the preparation shown in (A) measured on the right (magenta) and left (green) sides of the midline (as shown in Figure 3B) oscillate in anti-phase. (C) Ca++ signals corresponding to Phase 1 (top) measured on either side of the midline are poorly correlated, whereas those corresponding to Phase 3 (bottom) are in phase. (For more detailed analysis of Ca++ signals from selected small ROIs within the VNC-Rk neurons see Figure 5—figure supplement 1.). (D–F) Analysis of Ca++ activity in abdominal muscles during the pupal ecdysis sequence. (D) Images from two complete cycles of alternating Ca++ signal in the abdominal musculature during Phase 2. Times and brackets indicate peak signal on each side of the midline, as in (B). Scale bar: 500 μm. (E) Phase 2 Ca++ signals measured on the right (magenta) and left (green) sides of the midline. (F) Ca++ signals corresponding to Phase 1 (top) measured on either side of the midline are poorly correlated, whereas those corresponding to Phase 3 (bottom) are in phase. (G) Timecourse of Ca++ activity in VGlut-expressing (motor) neurons of the abdominal ganglia in preparations in which the Rk-expressing neurons were activated (black trace) by ATP (arrow), or not activated because the P2X2 channel was not expressed (gray trace). Traces shown are representative of n = 6 experimental and n = 6 control preparations.


