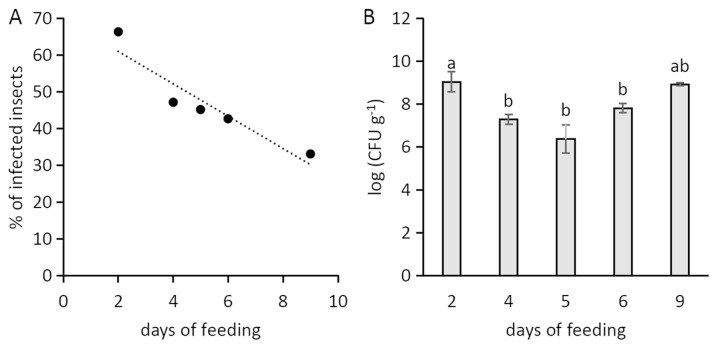
Fig. 2.
(A) Percentage of infected insects in relation to artificial feeding time. The correlation was significant according to Fisher’s exact test. (B) Population of Pseudomonas syringae pv. actinidiae in the contaminated insects, expressed according to the days of artificial feeding. The data refer to 12–20 individual insects per each sampling point (A) and to those positive for Psa among them (B) in the 2013 and 2014 artificial feeding experiments. Bars with different letters are significantly different according to Fisher’s LSD test (P < 0.05).

