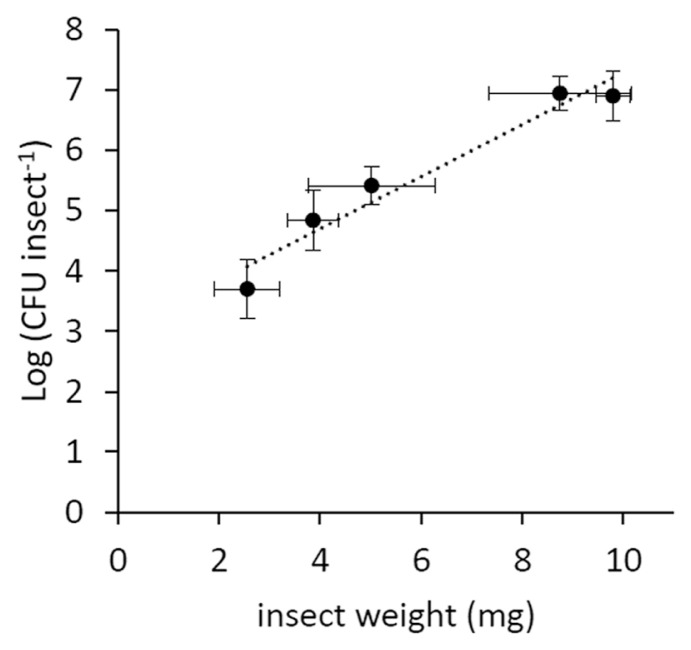
Fig. 3.
Bacterial load in relation to insect weight. Data refer to average values with standard errors of contaminated insects (5–9 per point) taken at the same sampling times in the 2013 and 2014 artificial feeding experiments. The correlation is significant according to Fisher’s exact test (P < 0.05).

