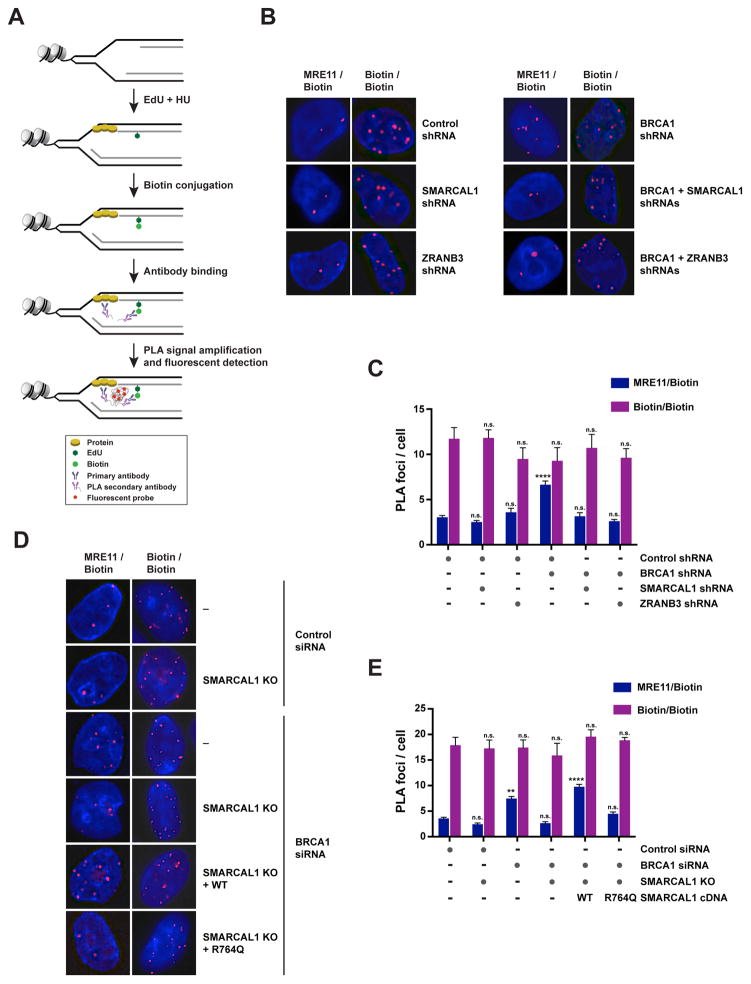
Figure 4. Detection of MRE11 association with nascent DNA in BRCA1-deficient cells upon depletion of SMARCAL1 or ZRANB3.
(A) Schematic of the proximity ligation assay (PLA) utilized to detect the association of proteins with nascent DNA, as described in the main text.
(B) Representative images of PLA foci obtained in the indicated HU-treated MCF10A cells upon incubation with anti-MRE11 and anti-biotin antibodies (MRE11/Biotin; left) or with two distinct anti-biotin antibodies (Biotin/Biotin; right) according to the protocol depicted in (A). Each red spot corresponds to an interaction. DNA was stained with DAPI (blue).
(C) Representation of the mean + SEM of the number of MRE11/Biotin (blue) PLA foci per cell (≥ 2 foci) in HU-treated MCF10A cells upon depletion of the factors indicated in (B). The mean + SEM of the number of Biotin/Biotin (purple) PLA foci per cell (≥ 2 foci) was used as control for the number of replication sites in each condition. 100–300 cells were analyzed per condition. Statistical analysis was conducted using one-way ANOVA on each sample relative to control samples (n.s., not significant; **** p<0.0001). Data are representative of 2 independent replicates.
(D) Representative images of PLA foci obtained from HU-treated control or SMARCAL1 KO MCF10A cells as shown in (B). Cells were subjected or not to BRCA1 siRNA-mediated depletion and reconstitution with WT or R764Q-mutant SMARCAL1 proteins.
(E) Representation of the mean + SEM of the number of MRE11/Biotin (blue) and Biotin/Biotin (purple) PLA foci per cell (≥ 2 foci) in HU-treated control and SMARCAL1 KO MCF10A cells, as shown in (D). 100–300 cells were analyzed per condition. Statistical analysis was conducted as in (C) (n.s. not significant; ** p<0.01; **** p<0.0001). Data are representative of 2 independent replicates. See also Figure S4.

