Figure 2.
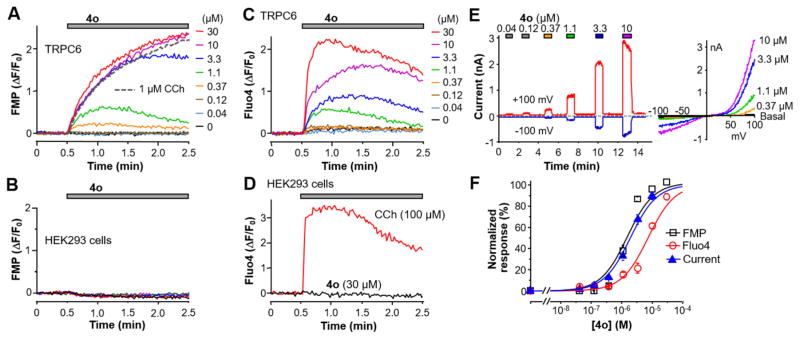
Lead compound 4o identified from HTS activated TRPC6 expressed in HEK293 cells. (A) Representative traces of membrane potential changes evoked by carbachol (CCh, 1 μM, gray dashed line) or varying concentrations of compound 4o obtained from the compound library (colored lines) in the TRPC6 cells. The fluorescence increases indicate depolarization. (B) Compound 4o did not induce membrane depolarization in parental HEK293 cells. (C) Representative traces of Fluo4 fluorescence changes, indicative of [Ca2+]i increase, evoked by varying concentrations of compound 4o in the TRPC6 cells. (D) CCh, but not compound 4o, evoked [Ca2+]i increase in the parental HEK293 cells. (E) Representative traces of whole-cell currents at +100 mV (red trace) and –100 mV (blue trace) elicited by varying concentrations of compound 4o in a TRPC6 cell. The bath contained 2 mM Ca2+, and the pipet solution had 400 nM free Ca2+ buffered by BAPTA. Voltage ramps from +100 mV to –100 mV were applied every second. Current–voltage (I–V) relationships obtained from the voltage ramps for peak currents elicited by selected compound concentrations are shown at right. These I–V curves are typical to TRPC6 currents evoked through receptor stimulation.37 (F) Concentration response curves for compound 4o activation of TRPC6, as determined by the membrane potential assay (FMP), Ca2+ assay (Fluo4) and electrophysiology recording shown in A, C, and E, respectively. For fluorescence assays, area under the curve, and for whole-cell recordings, peak current changes at +80 mV were used for quantification. Solid lines represent fits by the Hill equation, which yielded the EC50 values described in the text.

