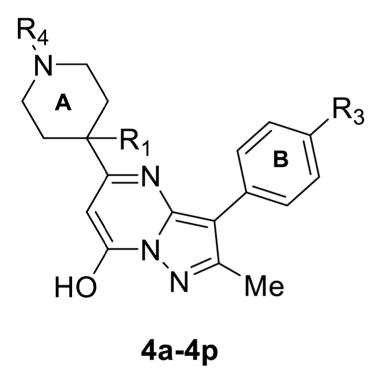
Table 1.
Structures of Compounds 4a–4p and Their Effects on TRPC6 and TRPC4

| |||||
|---|---|---|---|---|---|
| Compound | R1 | R3 | R4 | TRPC6 EC50(μM)a | TRPC4β+MOR IC50(μM)b |
| 4a | H | F |

|
12.3±1.2 | ~10 |
| 4b | Me | F |

|
NA | NA |
| 4c | Me | F |

|
NA | NA |
| 4d | Me | F |

|
NA | NA |
| 4e | Me | NO2 |

|
NA | NA |
| 4f | Me | NO2 |

|
NA | NA |
| 4g | Me | NO2 | CO2Et | ~8c | NA |
| 4h | Me | F | Boc | NA | NA |
| 4i | H | NO2 | CO2Et | ~2c | NA |
| 4j | H | F |

|
28.8±8.3 | ~35 |
| 4k | H | F |

|
NA | NA |
| 41 | H | Cl | Boc | NA | NA |
| 4m | H | Cl | Cbz | 7.79±0.05 | NA |
| 4n | H | CF3 | CO2Et | 1.39±0.01 | NA |
| 4o | H | F | CO2Et | 4.66±0.03 | NA |
| 4p | H | F | Cbz | 3.91±0.02 | NA |
EC50 determined based on Ca2+ assay.
IC50 against that activated by 1 μM DAMGO, estimated based on one experiment with triplicates;
Estimated value because of the self-fluorescence of the compound.
NA: No activity.
