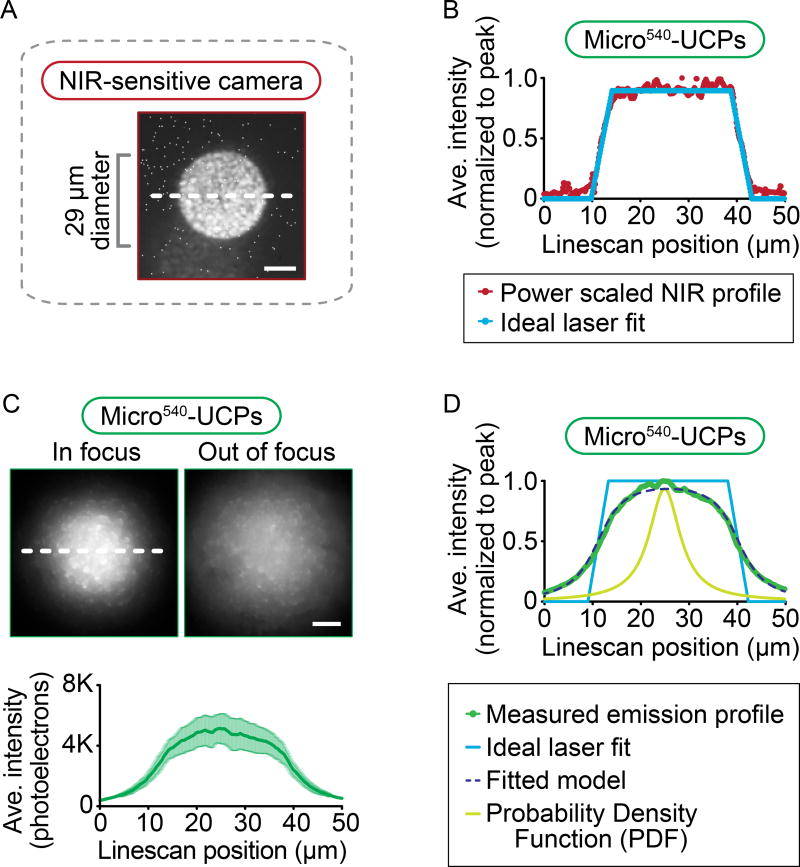
Figure 4. Beam profiles from micro540-UCPs show a broad Lorentzian fit.
Image (A) of 29 µm diameter masked circular region of 1470 nm NIR irradiation on a mirrored slide taken with an NIR-sensitive camera. (B) The beam profile of the excitation laser (shown in maroon) is recorded and then adjusted to the power dependence for micro540-UCPs (Figure 1C) and finally, these profiles are fitted to an ideal trapezoidal laser profile (shown in Carolina blue) to remove the noise. (C) Representative images of the visible light emission from micro540-UCPs irradiated with a 29 µm diameter NIR beam when the beam is either in focus (left panel) or out of focus (right panel) at the imaging plane. Scale bars = 10 µm. Background subtracted line scans of the in-focus images in (C) were performed and plotted as shown (C). The white dashed lines across the images indicate the region used for plotting the line scans. (D) Final result of fitting the beam profiles for micro540-UCPs (in green) to the convolution of the ideal laser profiles (in Carolina blue; B, D) and a Lorentzian probability density function (in light green), with the result of the best fit plotted with a dashed dark blue line (D). Data represents mean ± standard error from n = 3 independent experiments.

