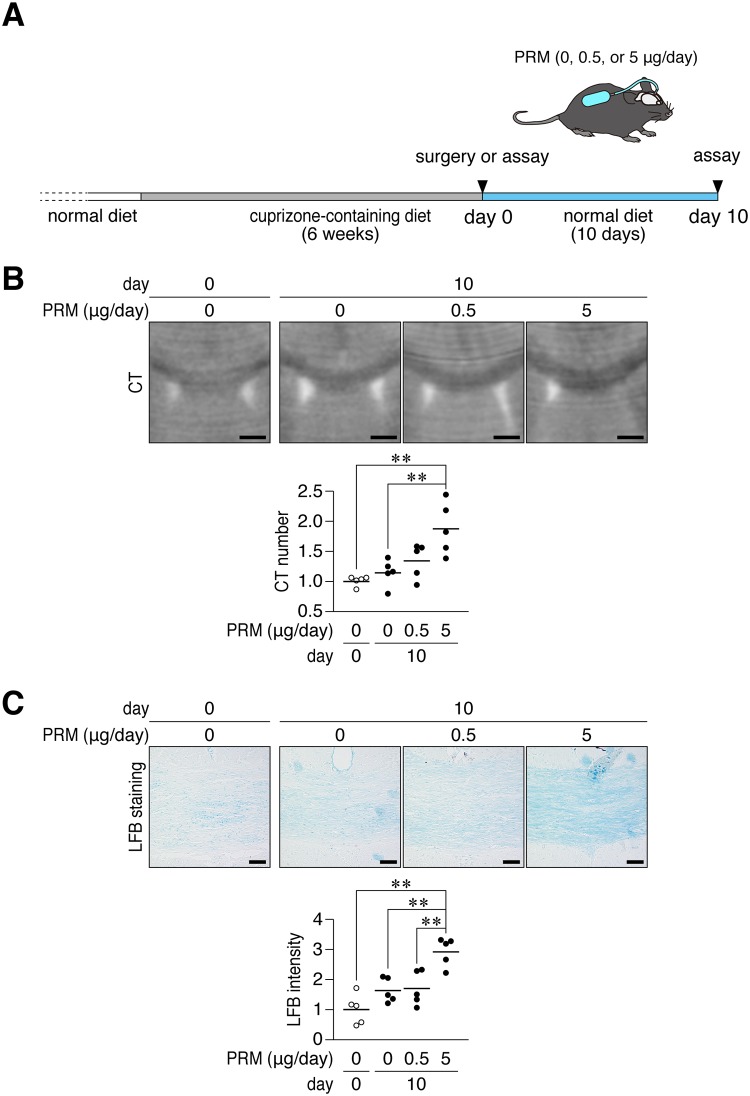
Fig 8. PRM enhanced remyelination after cuprizone-induced demyelination.
(A) Schematic drawing of cuprizone-induced demyelination and the administration of PRM. Mice were fed a cuprizone-containing diet for 6 weeks. At the end of this period, mice were implanted with osmotic pumps for the intracerebroventricular administration of PRM at 0.5 or 5 μg per day or vehicle for 10 days. (B) Coronal plane reconstruction of micro-CT scans. Scale bars, 1 mm. The plots show the relative value of their CT numbers in the dorsal corpus callosum, which was normalized to the value in the non-recovered control. **, p < 0.01, significant difference between the indicated groups (analysis of variance with Bonferroni’s post-hoc tests). (C) LFB staining. Scale bars, 50 μm. The plots show the staining intensity of LFB in the dorsal corpus callosum normalized to the value in the non-recovered control. **, p < 0.01, significant difference between the indicated groups (analysis of variance with Bonferroni’s post-hoc tests).

