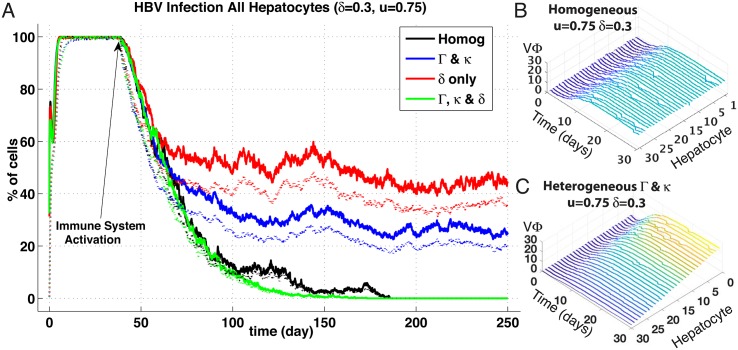
Fig 3. Spatial heterogeneities effects on HBV infection and clearance.
(Panel A) Results are in percentage of cells; averaged over n = 5 simulations of agent-based stochastic model. Inoculum of 2.109 HBV copies per mL at day 0 and immune responses activation at day 40 (δ = 0.3, u = 0.75). Legend: Solid lines represent percentage of cells in the liver with at least 1 HBV copy (VΦk+RΦk) and dotted lines percentage of cells in the liver with at least 1 cccDNA copy (CΦk). cccDNA survival to replenishment hepatocytes was set to zero probability. (1) Homogeneous base line case; (2) Gradients of HBV replication cycle efficiency (parameters Γ and κ) (3) Gradients of δ, (4) Gradients of both (Γ, κ) and δ. (Panels B & C) Ribbon plots before immune activation (t = 1–30 days) showing intracellular viral particles (VΦ) for each hepatocyte (sinusoid 5). Hepatocyte number order reflects proximity to sinusoidal periportal entrance, i.e., #1 at entry point, and #30 at pericentral exit. Panel B shows particle counts over sinusoid with homogeneous spatial distribution of HBV replication rates (Γ) and uptake (κ) whereas Panel C shows distribution with linear gradient of same parameters. Peak parameter values situated at periportal hepatocyte #1 and minimal at pericentral #30. Note linear distribution of VΦ corresponding to distribution of parameters with variance of 0.8; see section (3.2) for details.

