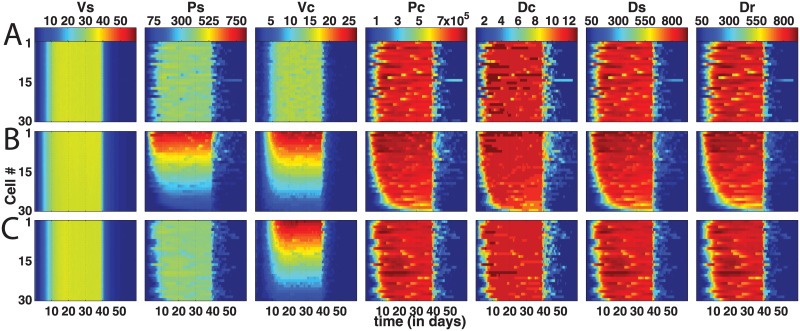
Fig 4. Spatial plots showing viral particles levels over cells within a single sinusoid per row (‘unit model’ #1) in three different parameter sets.
Plots are averages of n = 5 simulations that are evolution of only one sinusoid for 3 cases of agent-based stochastic model: (a) Homogeneous baseline case, (b) linear gradient-based heterogeneities of Γ and κ combined, and (c) linear gradient-based heterogeneity of κ alone. Columns correspond to the suite of either sinus particles (Vs, PΨ, two leftmost columns) or the full cohort of intracellular particles (VΦk to RΦk, 3rd column to last). For each plot, x-axis represents the time in days, y-axis represents spatial location so that y = 1 is the first hepatocyte cell at the periportal entry of the sinusoid and y = 30 is the 30th hepatocyte cell at the pericentral end of the sinusoid. Colour bars above each plot show levels of each particle for each respective column across the rows. Inoculation at day t = 0 and activation of immune responses (CYL and non-CYL) at day t = 40 (δ = 0.9, u = 0.25) similar to prior results shown, and cccDNA survival probability to daughter hepatocytes set to zero again. Variance for gradient heterogeneities: 0.8. (See Fig 3 for depiction of these gradient-based distributions.)

