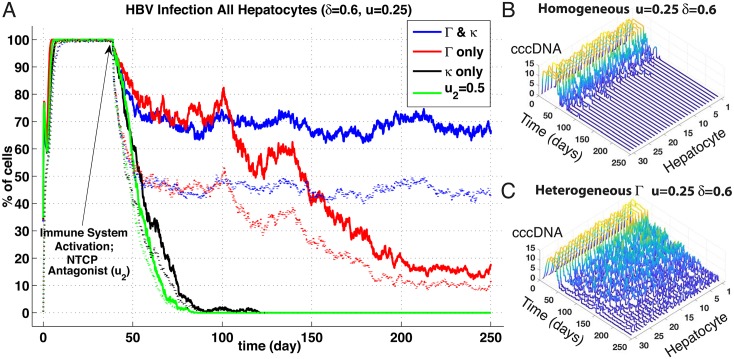
Fig 5. NTCP spatial heterogeneities effects on HBV infection and DoC.
(Panel A) Results plotted are in percentage of cells; averaged over n = 5 simulations of agent-based stochastic model. Inoculum of 2.109 HBV copies per mL at day 0 and immune responses activation at day 40 (δ = 0.6, u = 0.25) Plain lines represent percentage of cells in the liver with at least 1 HBV copy, Dotted lines represent percentage of cells in the liver with at least 1 cccDNA copy. cccDNA survival probability to replenishment hepatocyes set to zero. (blue trace) Gradient-based heterogeneities of HBV replication cycle efficiency, (red trace) Gradient-based heterogeneities of HBV replication cycle efficiency excluding the HBV uptake from sinusoid to cell (parameters Γ), (black trace) Gradient-based heterogeneity of the HBV uptake (parameter κ linked to NTCP presence), (green trace) Homogeneous base line case with activation of NTCP blocking (homogenous strength u2 = 0.5) at day 40. Heterogeneities linear distributions with variances set to 0.8 (see text). (Panels B & C) Ribbon plots showing progression for cccDNA counts over all 30 hepatocytes (sinusoid 5) with spatially homogeneous (Panel B) and heterogeneous Γ (Panel C) up to t = 250 days. Note, homogeneous distribution at these immune activity levels leads to clearance at around 100 days.

