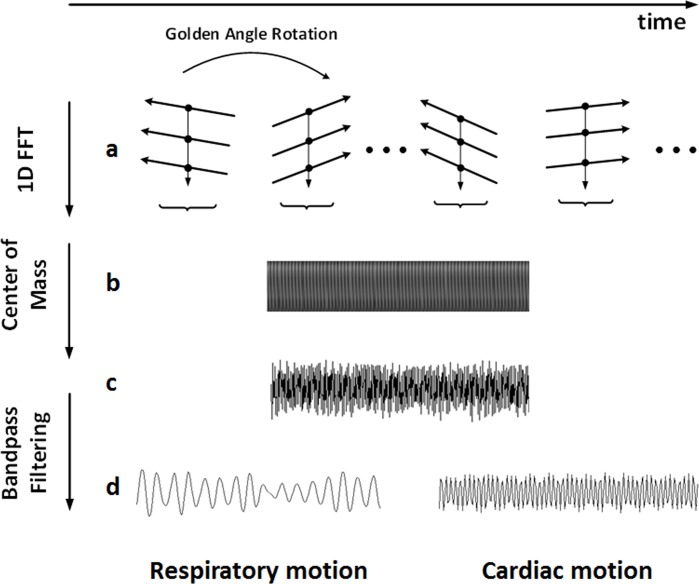
Fig 2. Pipeline of extracting the cardiac and respiratory motion signals.
(a) The central points (black solid circles) of each projection angle denote a self-gating data profile. (b) Z-intensity profile generated by performing 1D Fourier transform of the self-gating data profiles. (c) Mixed cardiac and respiratory motion signals were obtained by calculating the center of mass from (b). (d) The respiratory and cardiac motion signals extracted by bandpass filtering of (c) and used for data realignment.

