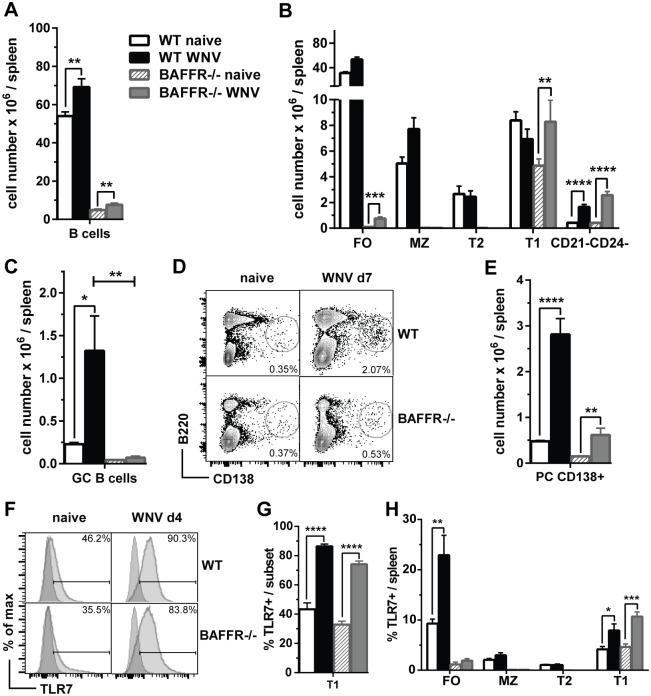
Fig 2. BAFFR-/- mice are defective in FO, MZ and T2 B cells and after WNV-TX infection do not up-regulate GC B cells and have reduced PCs.
Spleens from WT and BAFFR-/- naïve mice or mice infected for 7 days (A-E) or 4 days (F and G) with 102 PFU of WNV-TX were harvested and cell populations were determined by flow cytometry. Total splenocytes were stained with surface markers for total B cells (A), B cell subsets (B), GC B cells (C) and PCs (D and E). The gating strategy used to identify splenic B cell subsets (A and B) is shown in S1 Fig). GC B cells (C) were identified as GL7+CD38- B cells (gated on B220+ cells). PCs (D and E) are quantified as frequencies of B220loCD138+ cells in representative dot plots from three independent experiments (D) or as total cell numbers (E). In F and G frequencies of TLR7+ T1 B cells quantified by flow cytometry and shown as representative histograms (F) or bar graphs (G) from two independent experiments. H shows the frequencies of TLR7+ B cell subsets in the spleens of WT and BAFFR-/- mice before and 4 days after WNV infection. In A, B, C, E, G and H graphs show means ± SEM of absolute numbers and summarize data from three (A, B, C and E) or two (G and H) independent experiments (N = 9 or N = 6, respectively) In A, B, E, G and H statistics comparing naïve vs. infected mice were determined by two-tailed Student’s t test; in C statistics was performed by one-way ANOVA corrected with Holm-Sidak method for multiple comparisons; * p<0.05, ** p<0.01, *** p<0.001, **** p<0.0001.

