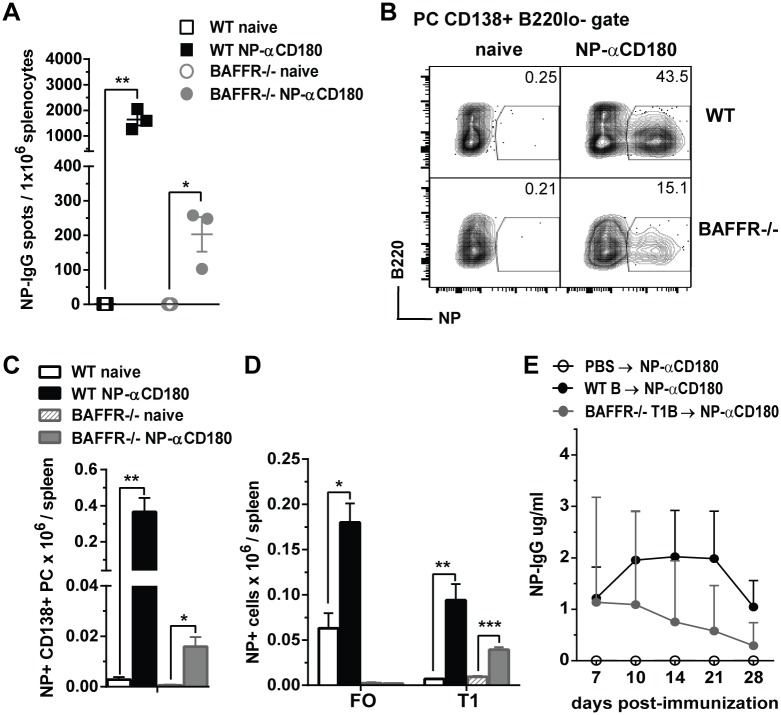
Fig 7. Antigen-specific IgG production after adoptive transfer of splenic WT B cells or BAFFR-/- T1 B cells into μMT mice and immunization with NP-αCD180.
A-D, WT and BAFFR-/- mice were immunized i.v. with 50 ug/mouse of NP-αCD180; 7 days after immunization spleens were harvested from naïve and immunized mice, NP-IgG ASCs were measured by ELISPOT (A), and NP-specific cell populations were determined by flow cytometry (B-D). In B and C, PCs were gated as CD138+ B220lo- cells and NP-specific PCs are shown as frequencies in representative dot plots (B) and as absolute cell numbers (C). In D, absolute cell numbers of NP-specific FO and T1 B cells are shown (the gating strategy is shown in S1 Fig). In A-D, data are from one representative of two independent experiments using three mice/group. In A, C and D, data shown are means ± SEM, statistics were determined by two-tailed Student’s t test and significant p values are indicated as follows: * p<0.05, ** p<0.01, *** p<0.001. E, 20 x 106 purified (see Methods section) total B cells from WT mice and T1 B cells from BAFFR-/- mice or PBS as vehicle control were transferred i.v. into μMT recipients 18 h before i.v. immunization with 100ug/ mouse of NP-αCD180. NP-specific IgG levels were measured by ELISA at the indicated time points post-immunization. Data are from one representative of two independent experiments with 4 recipient mice per group. In E, data are shown as means ± SEM and statistics were determined by two-tailed Mann-Whitney t test and at the indicated points, a significant p value of * p<0.05 was found for μMT mice adoptively transferred with WT B cells or BAFFR-/- T1 B cells compared to μMT mice inoculated with PBS.

