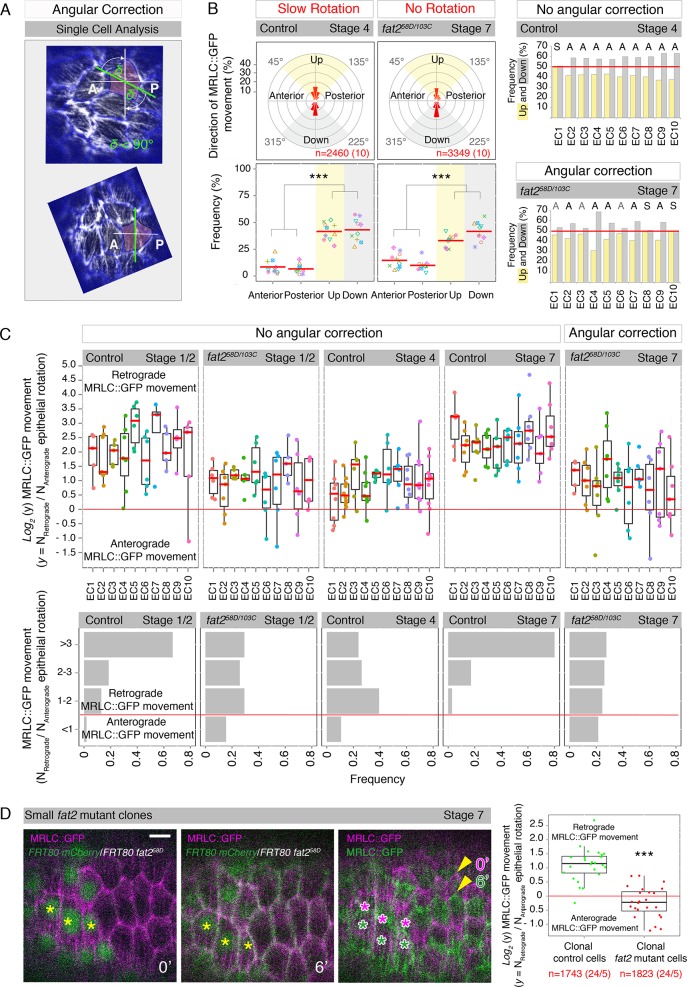
Fig 2. Fat2 locally both directs and reinforces Myo-II in individual follicle cells to promote epithelial rotation.
(A) Angular correction approach (Material and Methods). Time-projected MRLC::GFP example of the angularly corrected image of fat2 mutant follicle cells. A = anterior, P = posterior. (B) First row: Angular distribution and fractions of MRLC::GFP movements as described (Fig 1) for the angularly corrected (Material and Methods) stage 4 (slow epithelial rotation) and fat2 mutant stage 7 (no epithelial rotation). Second row: Frequencies of MRLC::GFP movements for individual egg chambers after angular correction, in four quadrants (see description in Fig 1) with P-values < 0.001 (***) shown. Last panel: Frequencies of MRLC::GFP movement in Up and Down quadrants as a readout for Myo-II symmetry breaking in control stage 4 and the angularly corrected fat2 mutant stage 7. A = asymmetry (black = strong, grey = weak), S = symmetry. (C) First row: Weighted ratios of MRLC::GFP moving against (retrograde) and with (anterograde) the direction of epithelial rotation, plotted on a log2 scale. Dots represent individual follicle cells and colour individual egg chambers (EC). Box plots with median are shown. Symmetry border is at 0 (red line). Note that MRLC::GFP prefers to move mainly in a retrograde direction in individual follicle cells during rotation initiation (control stage 1/2) and fast epithelial rotation (control stage 7) in contrast to no epithelial rotation (stage 1/2 and stage 7) and slow epithelial rotation (stage 4) where a few cells also show anterograde MRLC::GFP movement. Second row: Frequencies of binned MRLC::GFP ratios over analyzed egg chambers and types of epithelial rotation are shown. (D) Ratios of MRLC::GFP, moving against (retrograde) and with (anterograde) the direction of epithelial rotation, analyzed in individual follicle cells of small fat2 mutant clones (lack of green nuclei, Material and Methods) and their control neighbours (green nuclei) are plotted on a log2 scale. The number of analyzed MRLC::GFP signals is indicated in red (number of analyzed follicle cells/egg chambers is shown in brackets). Coloured stars in images indicate the direction of epithelial rotation. Time and P-value < 0.001 (***) are shown. Scale bar = 5μm. Anterior is on the left.

