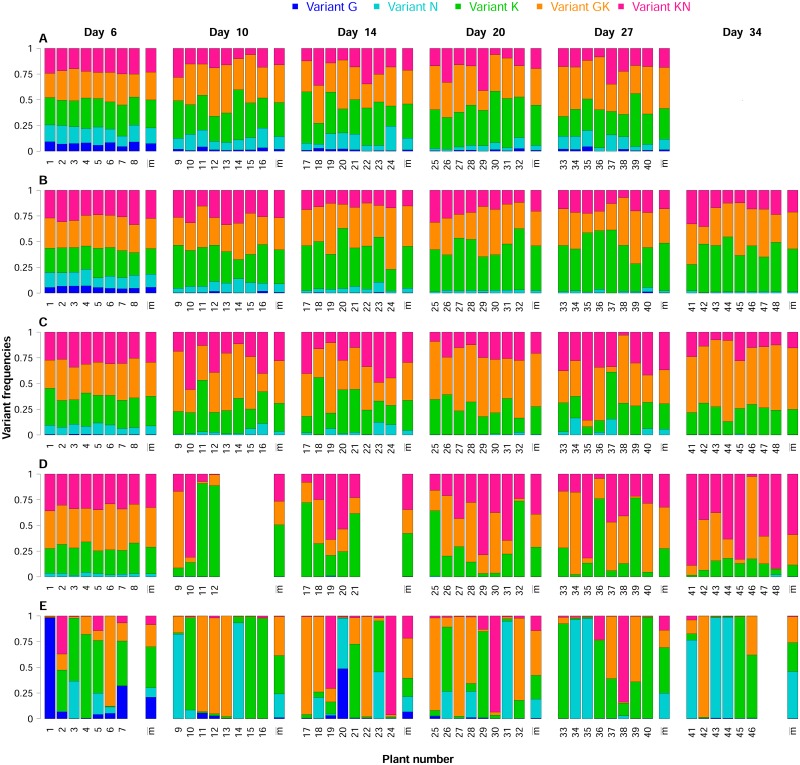
Fig 2. Five contrasting datasets obtained in the biological experiment.
Each line of bar plots represents the dynamics of virus variants in a single DH line over time: (A) 240, (B) 2430, (C) 2344, (D) 2321 and (E) 219. We inoculated 48 plants per DH line, and we sampled eight plants, which were subsequently removed from the experiment, at each of the six sampling dates (6, 10, 14, 20, 27 and 34 days post-inoculation). Within each bar plot, the frequencies of the five variants (see top of the figure for the color code) in each infected plant sample are represented by single bars (labeled from 1 to 48). The missing bars correspond to plant samples for which no viruses were detected. The last bar indicates the mean viral composition in the infected plants. Each individual bar plot corresponds to a single sampling date, indicated at the top of each column of barplots. The five DH lines displayed contrasting virus variant dynamics, consistent with contrasting patterns of selection and genetic drift. We could not sample plants of DH line 240 (A) 34 days post-inoculation, because severe necrosis symptoms invading the stem led to the death of all plants at this sampling date.

