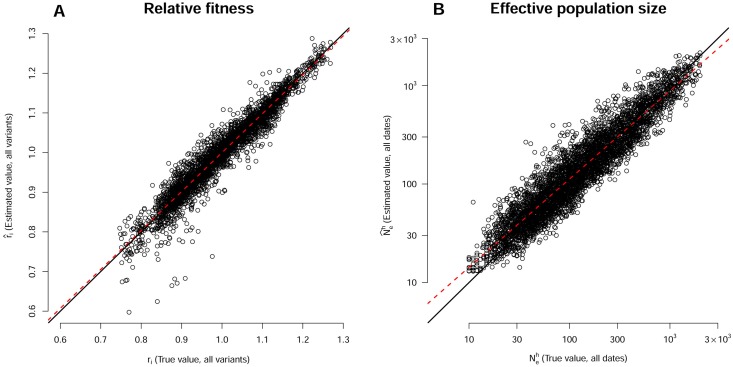
Fig 4. Inferences for variant fitness r and for the harmonic mean of effective population size , for the 750 datasets simulated with five virus variants.
(A) Correlation between true ri (x-axis) and estimated (y-axis) (all variants considered together). (B) Correlation between true (x-axis) and estimated (y-axis) (all sampling dates considered together, logarithmic scale). In both panels, the black line is the first bisector and the red dashed line is the best-fitting linear model. In panel A, the 9 points with correspond to datasets in which a highly counterselected variant was observed in only a few plants (5, on average, of the 48 plants) due to an initial low effective population size.

