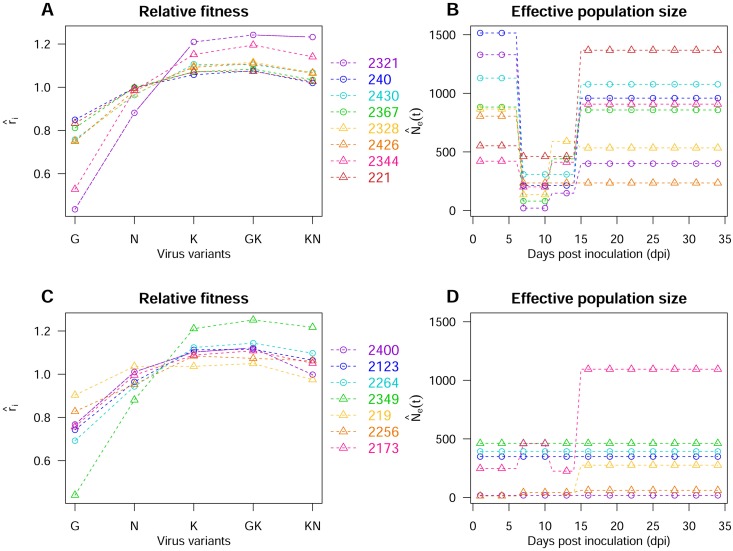
Fig 6. Fitness of virus variants and effective population size estimates for the 15 plant genotypes.
(A) Estimates of intrinsic rates of increase for each variant i for the DH lines 2321, 240, 2430, 2367, 2328, 2426, 2344 and 221. (B) Estimates of effective population size during the time course of the experiment for the DH lines listed in (A) and the model best supported by the data. (C) As for (A) for DH lines 2400, 2123, 2264, 2349, 219, 2256 and 2173. (D) As for (B) for the DH lines listed in (C).

