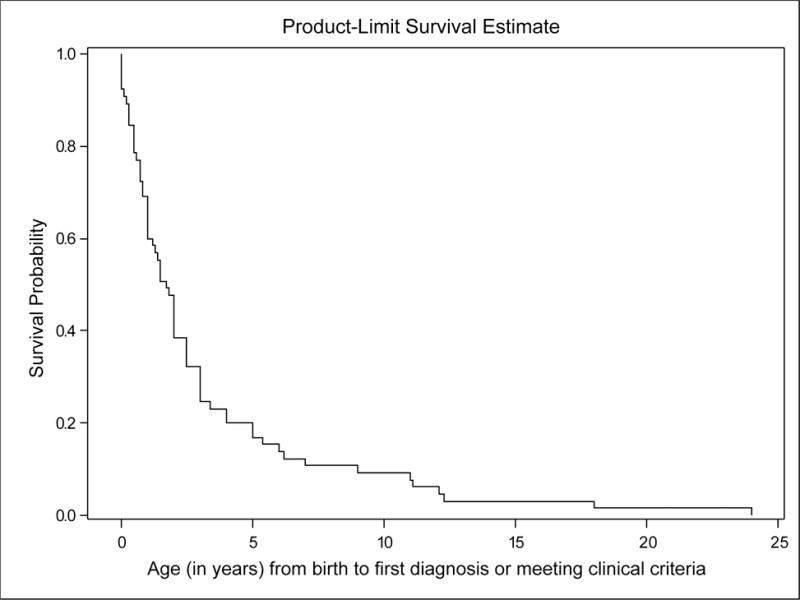
Figure 1.

The Kaplan-Meier curve for the disease inception age. Note that no patients were censored in Figure 1, because all patients necessarily had a disease inception age. In this plot, the Y-axis can be considered the fraction of patients as yet undiagnosed.
