
Figure 3.
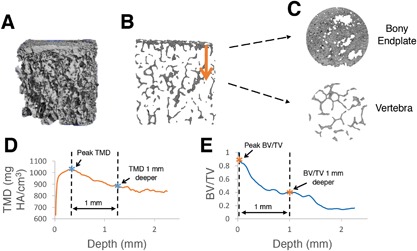
Process of calculating gradients in tissue mineral density (TMD) and trabecular bone volume fraction (BV/TV) at the endplate junction regions. (A) Three‐dimensional μCT data is loaded into custom IDL algorithm, (B and C) algorithm traverses from the dense bony endplate into the deeper vertebral bone, and average values of (D) TMD, and (E) BV/TV are plotted by depth. Differences between peak values (first asterisk) and values 1 mm deeper (second asterisk) were used to assess local gradients in TMD and BV/TV. Note that (B) and (C) are slices in the sagittal and transverse planes, respectively.