
Figure 7.
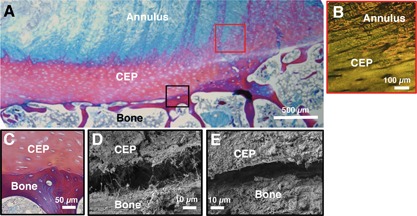
Sagittal histology (A,B,C) and SEM (D,E) images of the endplate junction. (A,C) are stained with trichrome stain, and (B) is stained with picrosirius red and visualized under polarized light. (B) shows annulus fibers integrating with the cartilage endplate (CEP), while (C) shows a clear demarcation between CEP and bone with no integration. (D and E) show small gap between CEP and bone using SEM. Black and red boxes on (A) are color‐coded to correspond with approximate regions of (B–E).