Figure 2.
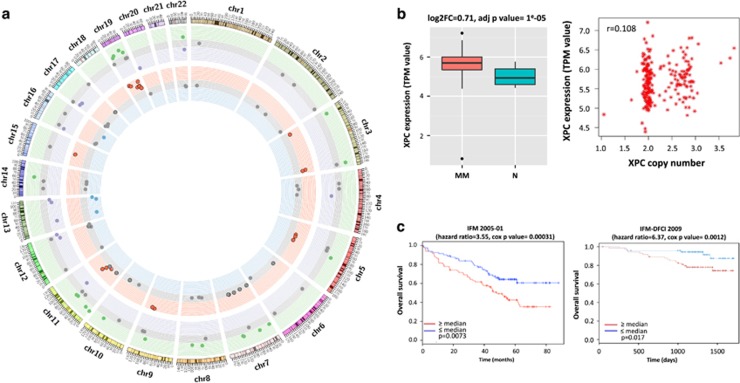
NER pathway is dysregulated in MM. (a) Multiple NER-related genes are dysregulated in MM. The Circos plot represents the variation of copy number and the expression level of 70 NER-related genes in a cohort of 292 newly diagnosed patients in comparison with 16 samples from normal plasma cells, based on RNA-sequencing and CytoScan Array data. Each dot corresponds to one NER gene. The outer circle represents gene expression level, green dots represent significantly higher expressed genes, purple dots to significantly lower expressed genes and gray dots to genes with no differential expression. The inner circle represents copy-number abnormalities. Red dots correspond to NER genes with amplifications, green dots are related to genes featured by deletions and gray dots relate to NER genes with no copy-number abnormalities. (b) XPC is overexpressed in context of amplification in MM. The right panel graph represents the correlation between XPC expression and XPC amplification in the same cohort. The left panel figure represents the level of expression of XPC in 292 myeloma patients (MM) in comparison with 16 normal plasma cells from healthy donors (N). MM patients significantly overexpress XPC (adj. P-value=1 × 10^5). (c) ERCC3 expression significantly impact OS in MM treated with alkylating agents. We evaluated the impact of ERCC3 expression level in MM patients in two different data sets (IFM-DFCI 2009 and IFM 2005-01). We observed that high ERCC3 expression is significantly associated with poor outcome and shorter OS in MM. The figure represents Kaplan–Meier curbs based on ERCC3 median expression level.

